Data visualization
I haven’t been writing very regularly (read: almost not at all), mostly because I haven’t been all that inspired and driven to journal my games. But that isn’t because I haven’t been playing great games. In fact, it’s almost been the opposite, with amazing gaming in good quantity
Because I started working for Splunk earlier this year, which is a big data company, I’ve recently been playing the product to get more familiar with it, and that means playing with visualization. I grabbed my data, above, and threw it into my play space, and ran a few searches and visuals.
2019 thus far
So, here’s the dashboard I eventually created:

The dashboard!
What have I learned? That I’ve played a shit-ton of For The Queen (duh), and next to that my most run games are ones friends have designed or that (gasp) I have a hand in designing:

Most played
Additionally the year started with a bunch of online gaming that has dwindled. I haven’t been playing online games almost at all in the last months. You can also see the peaks of game conventions here and there. And that when I play in conventions, there is a reduction in Meetup games (which makes sense since I’ve been out-of-town during those meetups). And I’ve played on airplanes twice this year!
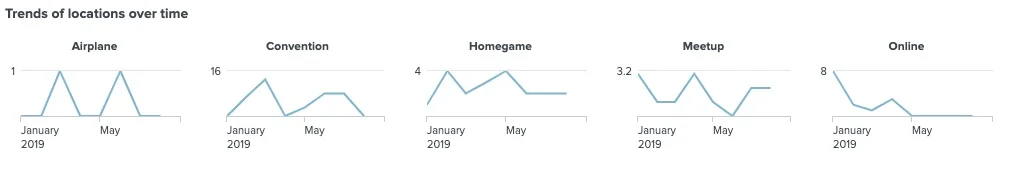
Trends for playing in locations
Apparently I play more GM-less games than GM-based ones (48 games versus 37 games at this point in the year). Although the bulk of my gaming is in the 3-hour time range (about 2/5th of my games), I’ve played as many 4-hour, 2-hour, and even 1-hour games! I’ve also had a pretty wide variety of table sizes; again 4- and 5-person tables are the majority, but not by a huge margin, with many games of 2- and 3-players, and also many with 6 or more.
What will I do with this information? Right now, likely nothing more than just learning about a product, and a bit about my habits.
I was partly inspired by friend Gerrit in the early part of the year, prior to any of this visualization stuff, since he’s been tracking his games for some time. I’ve kept track of mine in a Google sheet that currently looks something like this:

So, easy enough to keep going, and will just see how the trends change over time.